File:Detuning graph.png: Difference between revisions
Jump to navigation
Jump to search
(Plot of Energy levels as a function of detunings) |
(No difference)
|
Latest revision as of 21:35, 23 October 2014
Plot of Energy levels as a function of detunings
File history
Click on a date/time to view the file as it appeared at that time.
| Date/Time | Thumbnail | Dimensions | User | Comment | |
|---|---|---|---|---|---|
| current | 21:35, 23 October 2014 | 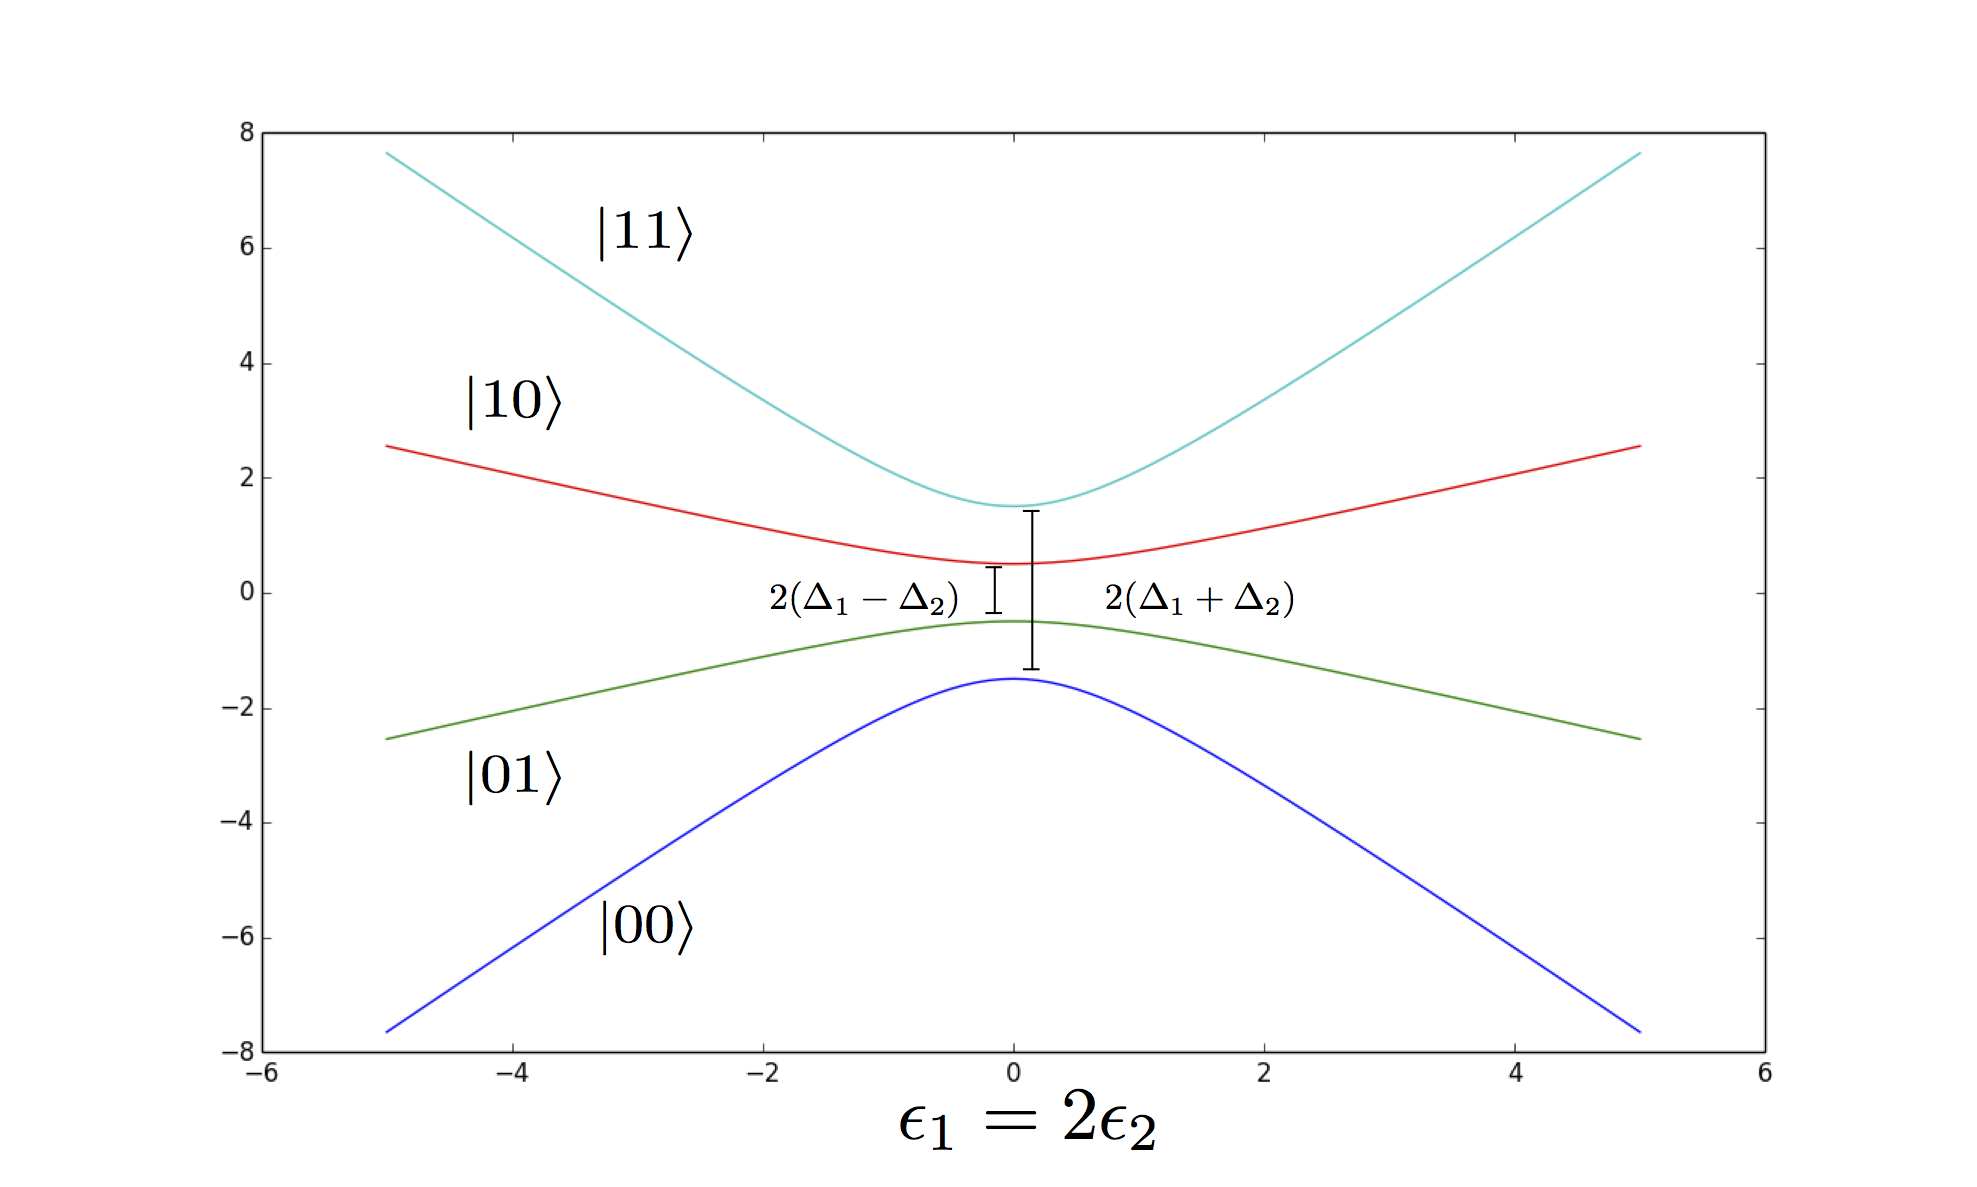 | 1,977 × 1,187 (179 KB) | AdamFrees (talk | contribs) | Plot of Energy levels as a function of detunings |
You cannot overwrite this file.
File usage
The following page uses this file: